断断续续三个月,终于把这个玩具轮子造了个大概,还是得写点东西总结一下。
前言
对着Spark依葫芦画瓢,于是有了SubSpark。SubSpark是啥?用一句简单的话概述就是一个Servlet-like Container。这里我用了Servlet-like这个词而不是Servlet,是因为我并没有实现完整的servlet-api,而是借鉴Spark定制了一套更轻量化的Route接口,能实现和Servlet类似的自定义处理HTTP请求的功能。更进一步,SubSpark实现的功能包括:
内置的HTTP Server
Server运行参数配置
IP、监听端口、运行线程数、静态资源根目录
Route
类似servlet-api中的Servlet接口,自定义处理HTTP请求
Filter
类似servlet-api中的Filter接口,过滤HTTP请求
Request / Response
封装了HTTP细节的对象
Session
实现简单的有状态请求机制
此外,相较于Tomcat / Jetty等Servlet Container,SubSpark会通过API更着重强调RESTful这一概念,这一点在文档中也有提及,为用户构建RESTful的微服务应用提供指导。
技术架构
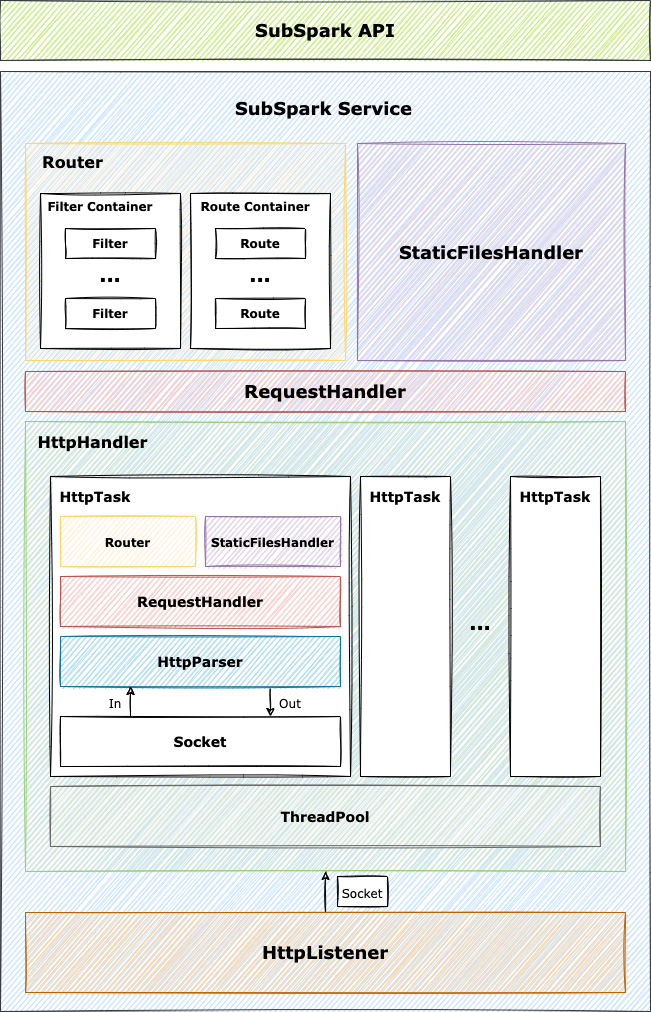
整个框架的架构如上图所示,工作流程还是比较清晰的。
HttpListener 负责启动 ServerSocket ,监听连接,并将获得的 Socket 交付 HttpHandler 。
HttpHandler 用 HttpTask 封装 Socket ,实现整个服务器业务逻辑。创建的 HttpTask 对象将交付 HttpHandler 中的线程池运行。
HttpTask 内部的 Socket 直接对接 HttpParser。它负责从 SocketInputStream 中读取字节流,构建 Request 对象,并将处理完毕的 Response 对象发送到 SocketOutputStream 。
RequestHandler 接收来自 HttpParser 构建的 Request 对象,解析HTTP请求,决定是调用 Router 进行动态处理还是调用 StaticFilesHandler 读取静态资源。
Service 组合了上述组件,向外提供统一的使用接口。
SubSpark 中用单例模式封装了 Service ,为用户提供接口。
性能测试
测试应用
1
2
3
4
5
6
7
8
9
10
import static org.subspark.SubSpark.*;
public class WebServer {
public static void main(String[] args) {
before("/hello", (req, res) -> System.out.println("In before /hello"));
get("/hello", (req, res) -> "Hello, World!\n");
after("/hello", (req, res) -> System.out.println("In after /hello"));
init();
}
}该应用为路径
/hello分别设置一条before filter,一条route,一条after filter。此外,在测试目录下还建立了一个静态资源文件夹,包含一个内容如下的index.html1
2
3
4
5
6
7
8
9
<html>
<head>
<title>Sample File</title>
</head>
<body>
<h1>Welcome</h1>
</body>
</html>测试环境
CPU: Intel Xeon Silver 4214 @ 2.20GHz, 36 cores
Memory: 128G
Disk: 5.0T
测试方法
使用Apache Bench,分别对调用route的路径
/hello和获取index.html的路径/进行测试十、百、千级并发测试。为控制变量,每次测试重启测试环境。测试参数
Apache Bench设置
1
ab -n [N] -t [T] -c [C] [test URL]
-n用于设置模拟请求的总次数为N-t用于设置每个模拟请求的最长停留时间为T秒;使用-t隐含携带参数-n 50000-c用于设置模拟请求的并发数为C通常
-n和-t分开使用,分别和-c进行组合:1
2
3
4
5
6
7
8# 模拟1个用户请求1000次
ab -n 1000 [test URL]
# 模拟500个用户共请求1000次(每个用户2次)
ab -n 1000 -c 500 [test URL]
# 模拟500个用户共请求50000次,每个请求最长等待10s
ab -t 10 -c 500 [test URL]测试设置
1
2
3
4
5
6
7
8
9# route测试
ab -n 30 -c 10 'http://127.0.0.1:8080/hello'
ab -n 300 -c 100 'http://127.0.0.1:8080/hello'
ab -n 3000 -c 1000 'http://127.0.0.1:8080/hello'
# 静态文件测试
ab -n 30 -c 10 'http://127.0.0.1:8080/'
ab -n 300 -c 100 'http://127.0.0.1:8080/'
ab -n 3000 -c 1000 'http://127.0.0.1:8080/'
测试结果
/hello1
2
3
4
5
6
7
8
9
10
11
12
13
14
15
16
17
18
19
20
21
22
23
24
25
26
27
28
29
30
31
32
33
34
35
36# ab -n 30 -c 10 'http://127.0.0.1:8080/hello'
Server Software: subhttpd/0.1
Server Hostname: 127.0.0.1
Server Port: 8080
Document Path: /hello
Document Length: 14 bytes
Concurrency Level: 10
Time taken for tests: 0.075 seconds
Complete requests: 30
Failed requests: 0
Total transferred: 4680 bytes
HTML transferred: 420 bytes
Requests per second: 400.26 [#/sec] (mean)
Time per request: 24.984 [ms] (mean)
Time per request: 2.498 [ms] (mean, across all concurrent requests)
Transfer rate: 60.98 [Kbytes/sec] received
Connection Times (ms)
min mean[+/-sd] median max
Connect: 0 0 0.1 0 0
Processing: 3 21 14.7 22 40
Waiting: 3 21 14.6 22 40
Total: 4 21 14.7 22 40
Percentage of the requests served within a certain time (ms)
50% 22
66% 24
75% 40
80% 40
90% 40
95% 40
98% 40
99% 40
100% 40 (longest request)1
2
3
4
5
6
7
8
9
10
11
12
13
14
15
16
17
18
19
20
21
22
23
24
25
26
27
28
29
30
31
32
33
34
35
36# ab -n 300 -c 100 'http://127.0.0.1:8080/hello'
Server Software: subhttpd/0.1
Server Hostname: 127.0.0.1
Server Port: 8080
Document Path: /hello
Document Length: 14 bytes
Concurrency Level: 100
Time taken for tests: 0.172 seconds
Complete requests: 300
Failed requests: 0
Total transferred: 46800 bytes
HTML transferred: 4200 bytes
Requests per second: 1748.63 [#/sec] (mean)
Time per request: 57.188 [ms] (mean)
Time per request: 0.572 [ms] (mean, across all concurrent requests)
Transfer rate: 266.39 [Kbytes/sec] received
Connection Times (ms)
min mean[+/-sd] median max
Connect: 0 1 1.3 0 4
Processing: 28 51 22.9 39 102
Waiting: 28 51 22.9 39 102
Total: 28 52 23.5 40 104
Percentage of the requests served within a certain time (ms)
50% 40
66% 55
75% 73
80% 75
90% 93
95% 98
98% 101
99% 102
100% 104 (longest request)1
2
3
4
5
6
7
8
9
10
11
12
13
14
15
16
17
18
19
20
21
22
23
24
25
26
27
28
29
30
31
32
33
34
35
36# ab -n 3000 -c 1000 'http://127.0.0.1:8080/hello'
Server Software: subhttpd/0.1
Server Hostname: 127.0.0.1
Server Port: 8080
Document Path: /hello
Document Length: 14 bytes
Concurrency Level: 1000
Time taken for tests: 0.749 seconds
Complete requests: 3000
Failed requests: 0
Total transferred: 468000 bytes
HTML transferred: 42000 bytes
Requests per second: 4005.29 [#/sec] (mean)
Time per request: 249.670 [ms] (mean)
Time per request: 0.250 [ms] (mean, across all concurrent requests)
Transfer rate: 610.18 [Kbytes/sec] received
Connection Times (ms)
min mean[+/-sd] median max
Connect: 0 1 3.1 0 17
Processing: 19 32 17.6 28 131
Waiting: 19 32 17.6 28 131
Total: 20 32 20.2 28 140
Percentage of the requests served within a certain time (ms)
50% 28
66% 30
75% 32
80% 33
90% 44
95% 81
98% 125
99% 134
100% 140 (longest request)/1
2
3
4
5
6
7
8
9
10
11
12
13
14
15
16
17
18
19
20
21
22
23
24
25
26
27
28
29
30
31
32
33
34
35
36# ab -n 30 -c 10 'http://127.0.0.1:8080/'
Server Software: subhttpd/0.1
Server Hostname: 127.0.0.1
Server Port: 8080
Document Path: /
Document Length: 121 bytes
Concurrency Level: 10
Time taken for tests: 0.091 seconds
Complete requests: 30
Failed requests: 0
Total transferred: 9240 bytes
HTML transferred: 3630 bytes
Requests per second: 329.41 [#/sec] (mean)
Time per request: 30.358 [ms] (mean)
Time per request: 3.036 [ms] (mean, across all concurrent requests)
Transfer rate: 99.08 [Kbytes/sec] received
Connection Times (ms)
min mean[+/-sd] median max
Connect: 0 0 0.1 0 0
Processing: 5 27 17.5 27 50
Waiting: 5 27 17.4 27 49
Total: 6 27 17.5 27 50
Percentage of the requests served within a certain time (ms)
50% 27
66% 29
75% 49
80% 49
90% 50
95% 50
98% 50
99% 50
100% 50 (longest request)1
2
3
4
5
6
7
8
9
10
11
12
13
14
15
16
17
18
19
20
21
22
23
24
25
26
27
28
29
30
31
32
33
34
35
36# ab -n 300 -c 100 'http://127.0.0.1:8080/'
Server Software: subhttpd/0.1
Server Hostname: 127.0.0.1
Server Port: 8080
Document Path: /
Document Length: 121 bytes
Concurrency Level: 100
Time taken for tests: 0.187 seconds
Complete requests: 300
Failed requests: 0
Total transferred: 92400 bytes
HTML transferred: 36300 bytes
Requests per second: 1604.43 [#/sec] (mean)
Time per request: 62.327 [ms] (mean)
Time per request: 0.623 [ms] (mean, across all concurrent requests)
Transfer rate: 482.58 [Kbytes/sec] received
Connection Times (ms)
min mean[+/-sd] median max
Connect: 0 1 1.2 0 4
Processing: 22 57 37.2 46 133
Waiting: 21 57 37.2 46 133
Total: 22 58 38.1 46 134
Percentage of the requests served within a certain time (ms)
50% 46
66% 52
75% 95
80% 96
90% 125
95% 131
98% 133
99% 134
100% 134 (longest request)1
2
3
4
5
6
7
8
9
10
11
12
13
14
15
16
17
18
19
20
21
22
23
24
25
26
27
28
29
30
31
32
33
34
35
36# ab -n 3000 -c 1000 'http://127.0.0.1:8080/'
Server Software: subhttpd/0.1
Server Hostname: 127.0.0.1
Server Port: 8080
Document Path: /
Document Length: 121 bytes
Concurrency Level: 1000
Time taken for tests: 0.639 seconds
Complete requests: 3000
Failed requests: 0
Total transferred: 924000 bytes
HTML transferred: 363000 bytes
Requests per second: 4693.20 [#/sec] (mean)
Time per request: 213.074 [ms] (mean)
Time per request: 0.213 [ms] (mean, across all concurrent requests)
Transfer rate: 1411.63 [Kbytes/sec] received
Connection Times (ms)
min mean[+/-sd] median max
Connect: 0 1 2.7 0 15
Processing: 14 27 22.1 20 145
Waiting: 14 27 22.1 20 145
Total: 14 27 24.5 20 154
Percentage of the requests served within a certain time (ms)
50% 20
66% 22
75% 23
80% 26
90% 45
95% 59
98% 137
99% 148
100% 154 (longest request)
结果分析
本次测试所用的服务器性能比较强,但即使在这种情况下,以Apache为对比,对同一静态文件
index.html在三种测试参数的最长完成时间分别为:1ms,10ms,33ms。可以看到在SubSpark的服务器在性能上距离工业级产品还有不小的距离。我准备后续继续做一些性能优化,目前正在准备用Netty重写
HttpListener和HttpHandler,替换目前的BIO方案。
结束语
像我一样的初级程序员最容易进入的误区之一就是过于重视编码而忽略了围绕项目周边的一系列建设。这个项目是我第一次用尽可能贴近工业界的标准来进行项目管理,包括统一规范的Git Message,单元测试,压力测试,文档编写,打包发布等。从中也能体会到做一个好的项目是多么不易。
造出的轮子虽然难以进入生产环境,不过能在这一过程中经历到更标准的项目管理,钻研到协议规范,体会到工业级产品的实现难点倒也受益颇多,让我对servlet container的工作原理有了更深刻的认知。